IMDA Core Functions
You can load MiXCR output files (alignment and clones) into IMDA and use the following analysis and visualisation methods:
- Undetermined Read Analysis
- Clonality Analysis
- Diversity Analysis
- Clonotype Overlap Analysis
- V(D)J Gene Segment Analysis
- Sample Similarity Analysis
After (optional) preprocessing steps usind the open source tools wrapper (do_MIGEC, do_MiXCR, do_Bowtie2) and the IMDA Prep modules, based on these information the following measures are calculated, visualized and summarized within ithe IMDA Core.
IMDA Core offers several methods for analysing and comparing samples. By now, descriptive statistics, clonotype and diversity analysis based on the CDR3 sequences can be performed. Further, sample comparison based on clonotype overlap and V(D)J segments similarity can be performed automatically. All output files are located on the path you have selected at the beginning as glob_path.
Undetermined Read Analysis
Undetermined reads are mapped on a individually designed libraries using bowtie2-build command (see Download for an example with TCR genes and PHIX genome).
After the mapping is completed, IMDA Core provides methods for assigning the reads within the sam output file to one of the following groups:
- PhiX: successfully aligned reads on PhiX reference genome.
- Low quality: mean Phred quality score lower 30
- Junk: reads containing consecutive nucleotides in unexpectedly high number
- TCR Junk: successfully aligned reads on TCR reference genes with mean Phred quality score greater than 30
- Other: reads which are not assigned to any of the groups above
In case of custom libraries there is no distinction between the groups PhiX and TCR junk. All successfully mapped reads are assigned to a group named Mapped.
The results are visualised as pie plot and numeric data is stored in the summary files.
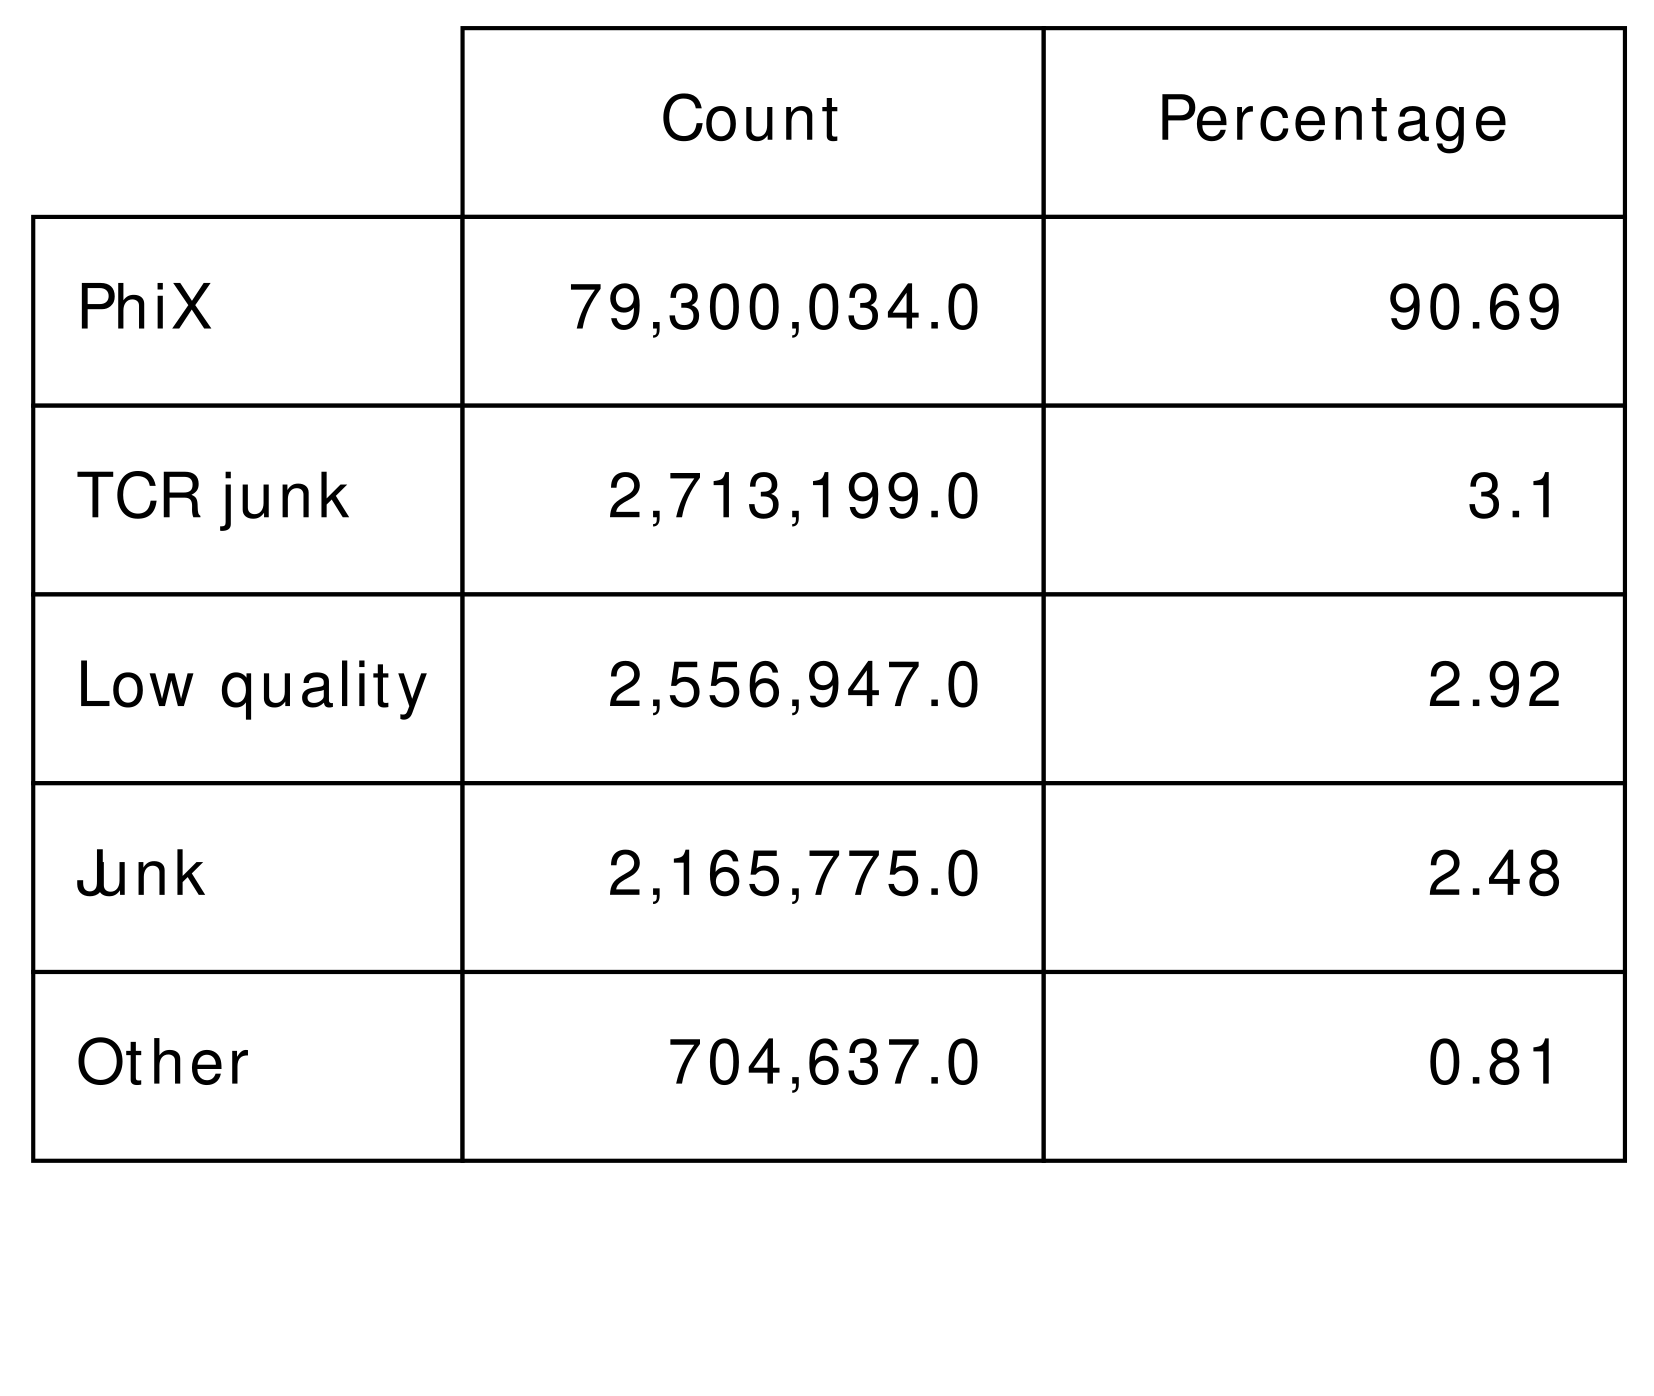
Figure 2A: Table view of undetermined |
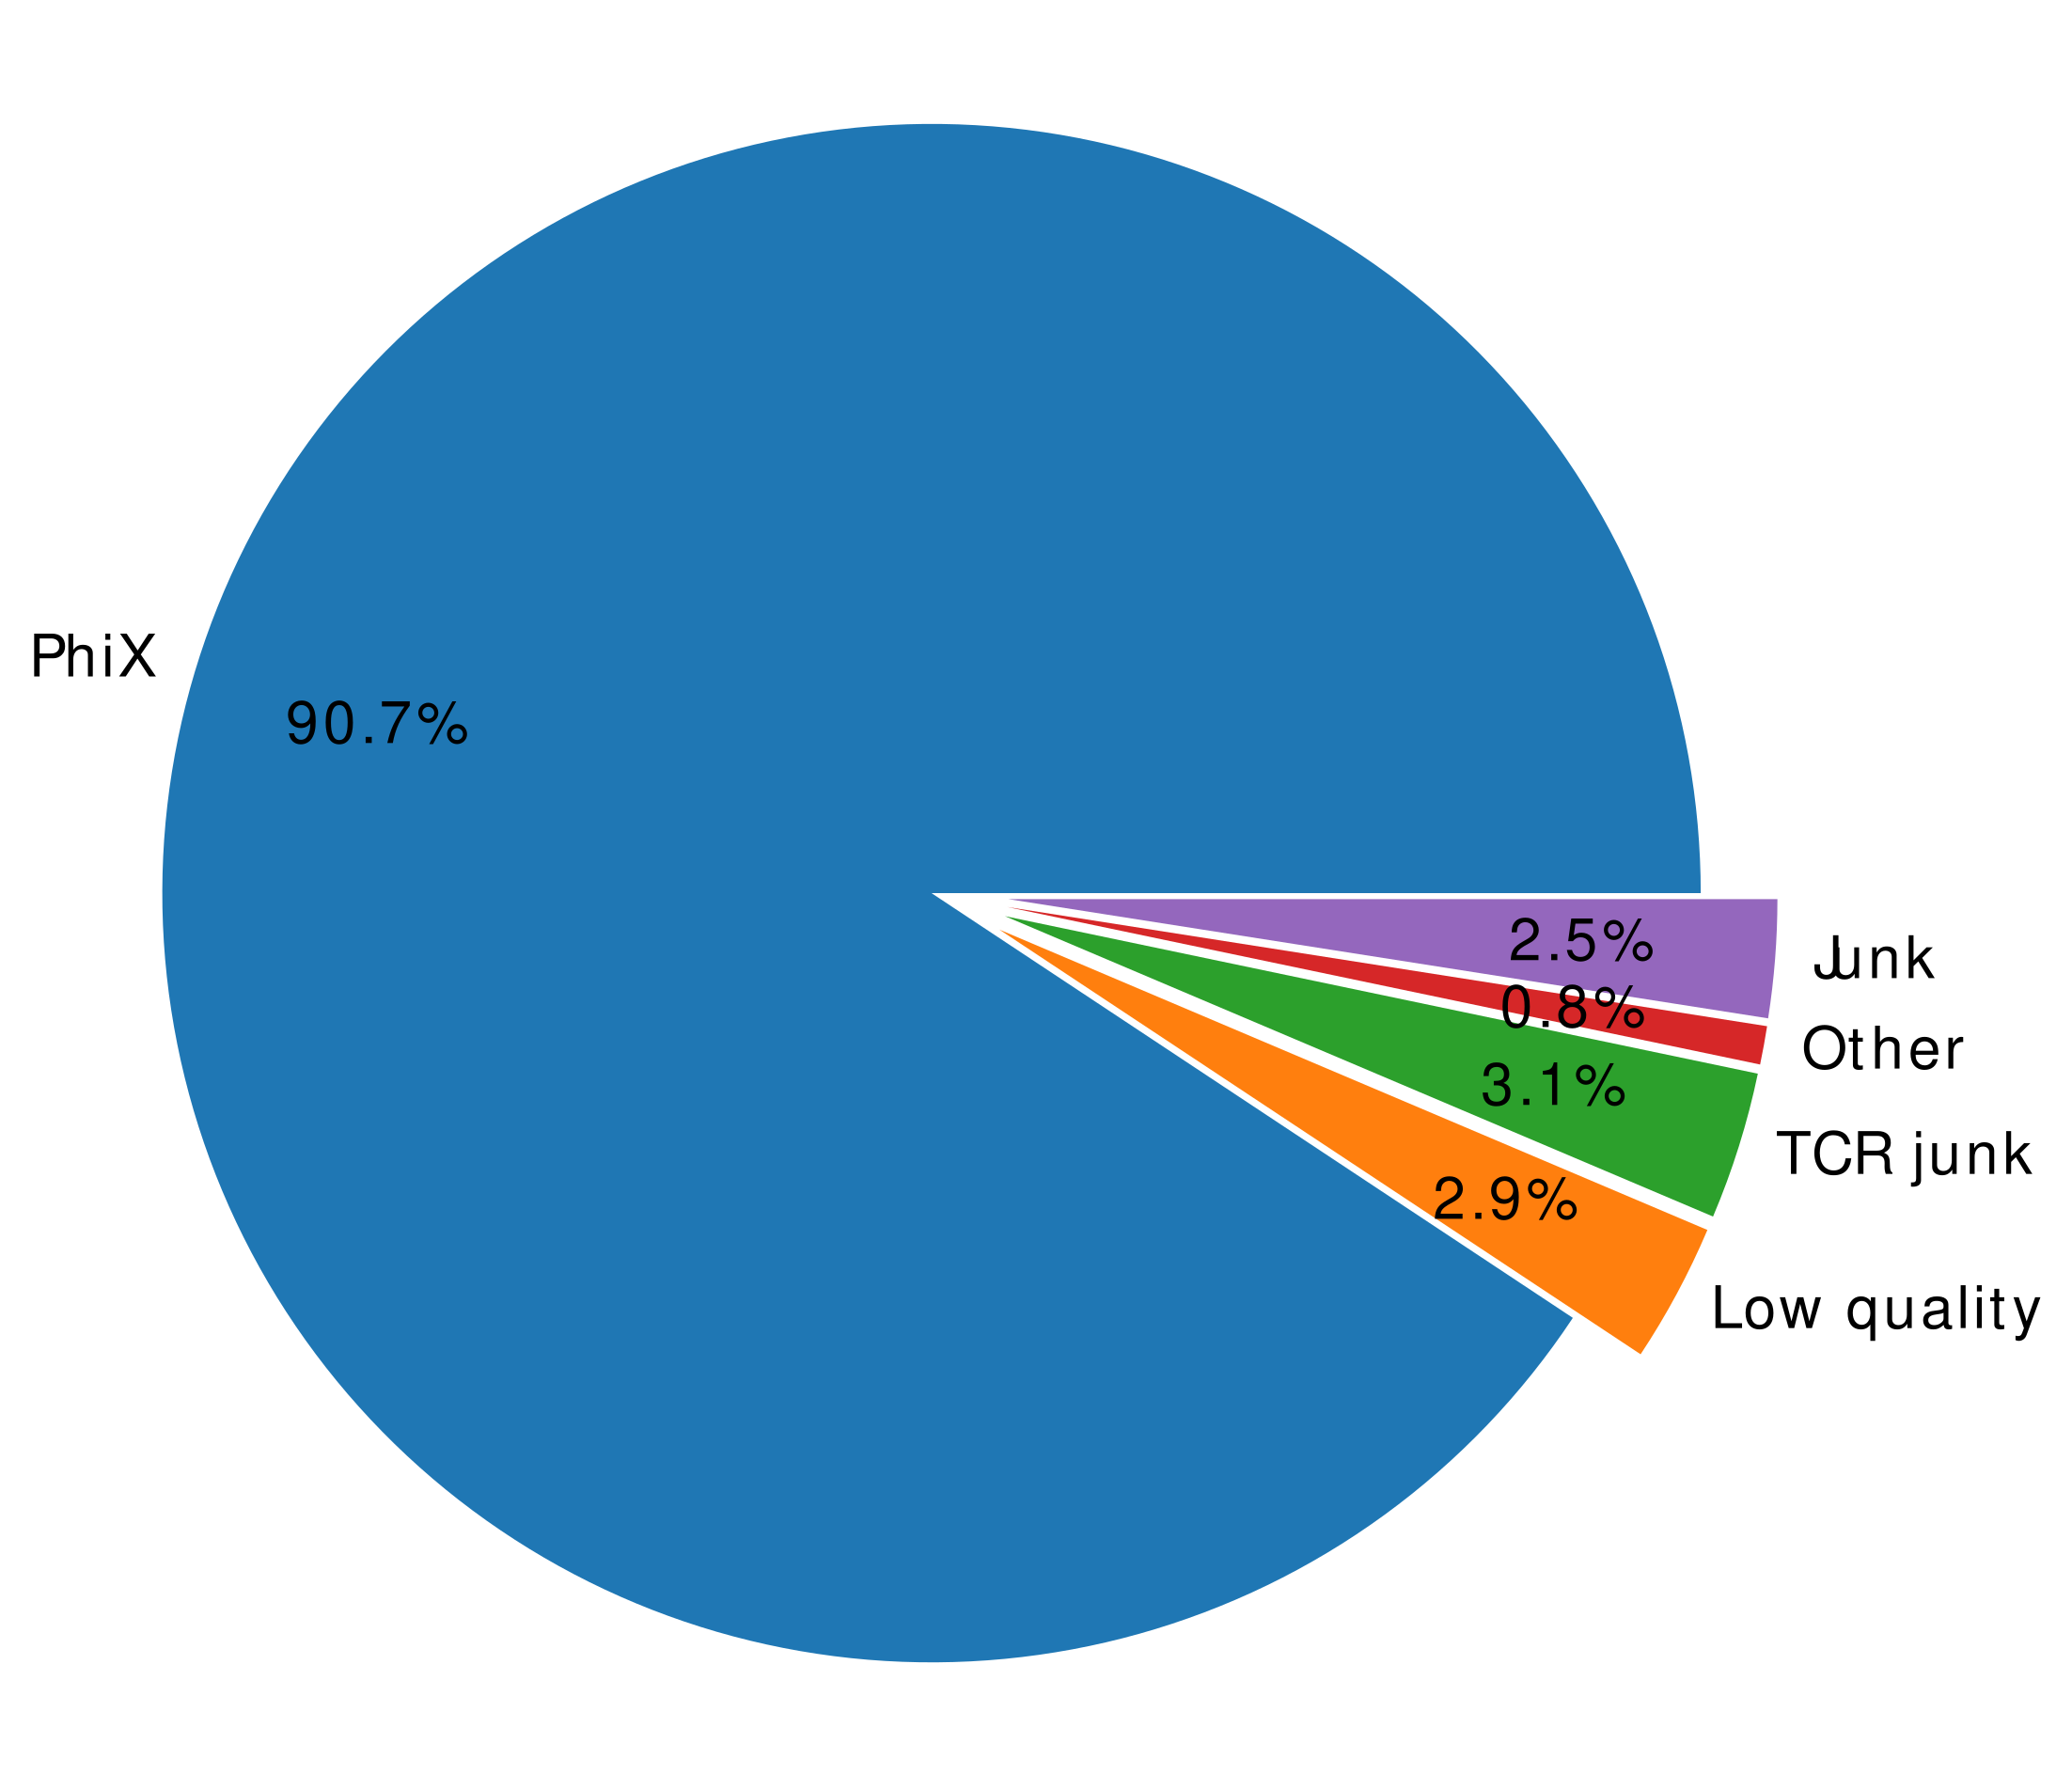
Figure 2B: Visualisation of undetermined |
Clonality Analysis
The open source tool MiXCR and the implemented IMDA Prep modules provide tab-delimited alignment and clone files for each sample. These files include information about the mapped reads, the associated V(D)J hits and CDR3 nucleotide and amino acid sequences. The clone file provides information about the assembled clonotypes.
For better interpretation of the clonality, IMDA visualises the CDR3 nucleotide and amino acid length distribution (Figure 3A) as well as shown in Figure 3B, the count and frequency of the top n clonotpyes (here n = 20).
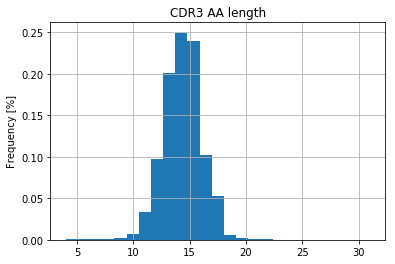
Figure 3A: CDR3 amino acid |
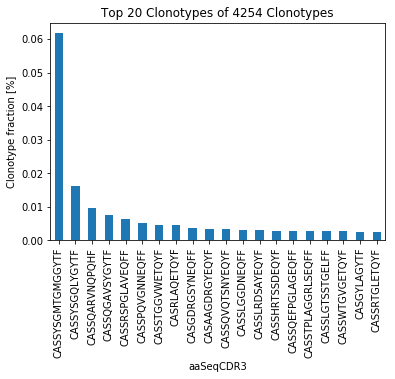
Figure 3B: Frequency of the |
Diversity Analysis
The open source tool provides various diversity indices and within IMDA the diversity curves based on the parameter optimization approach used in ImmuneExplorer (IMEX) are calculated.
For receiving the diversity curves an amount of n clonotypes (default nc = 2500) of the whole amount of clonotypes is continuously inferred and the unique CDR3 sequences are counted.
Results are visualised within bar charts for the diversity indices and diversity curve plots (Figure 4). All numeric data and visualisations are stored in summary files.
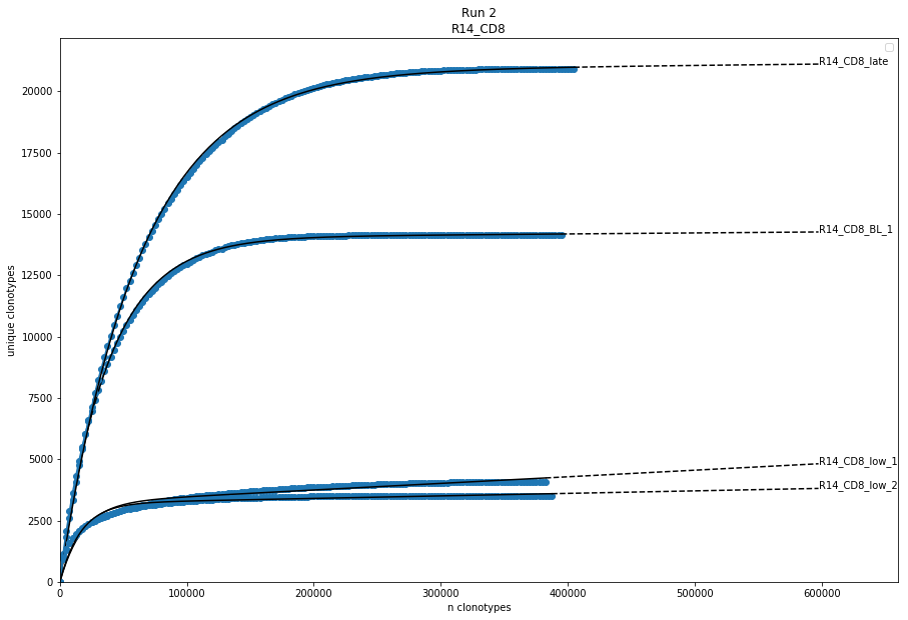
Figure 4: Diversity curves
Clonotype Overlap Analysis
Clonotype overlap analysis provides information about shared clonotypes of two samples. This method serves as quality control in case of biological and technical replicates, reveals information about potential cross-sample contaminations and is a first step for later-on identification of expanded clonotypes in the field of transplantation.
For each sample pair a linear model (LM) plot is generated (Figure 5A). Further Pearson R² value is calculated and a heatmap showing the correlations of the samples (Figure 5B).
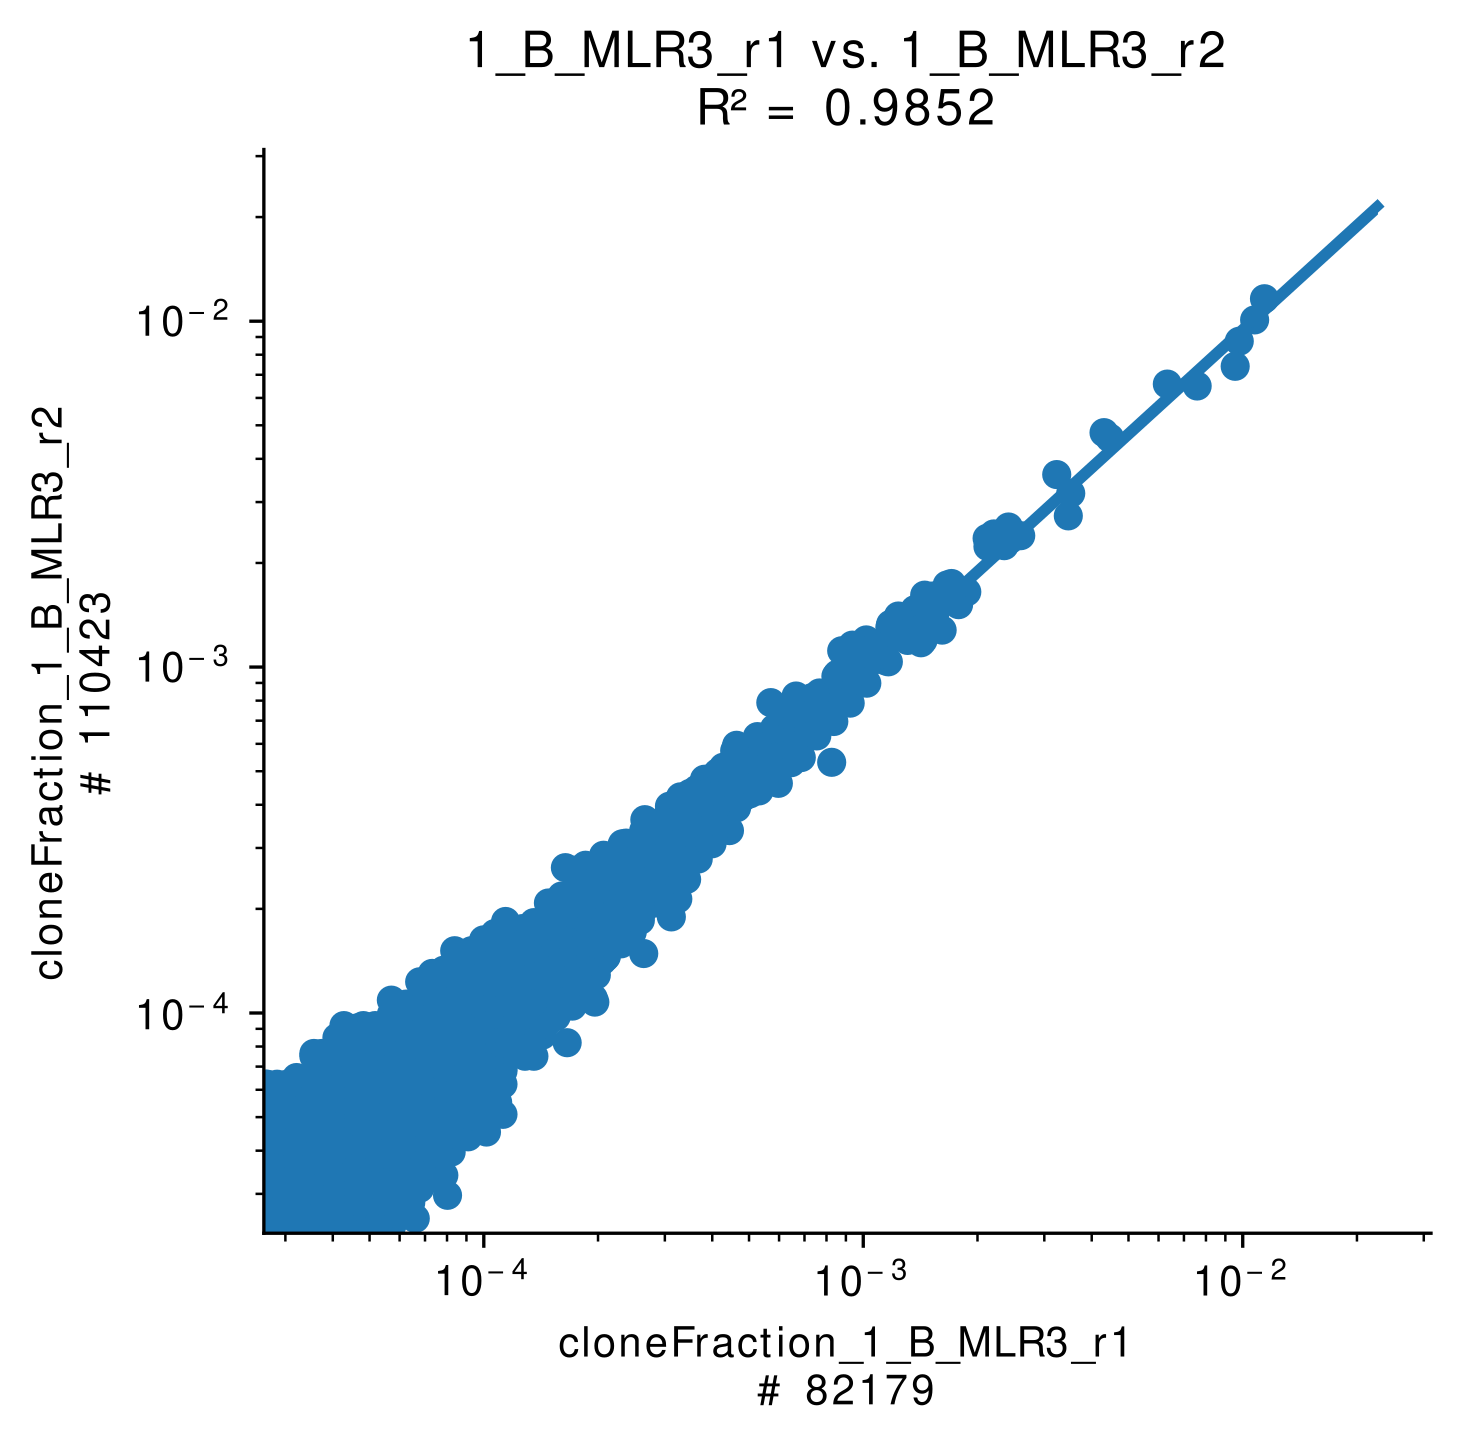
Figure 5A: Shared clonotypes of two |
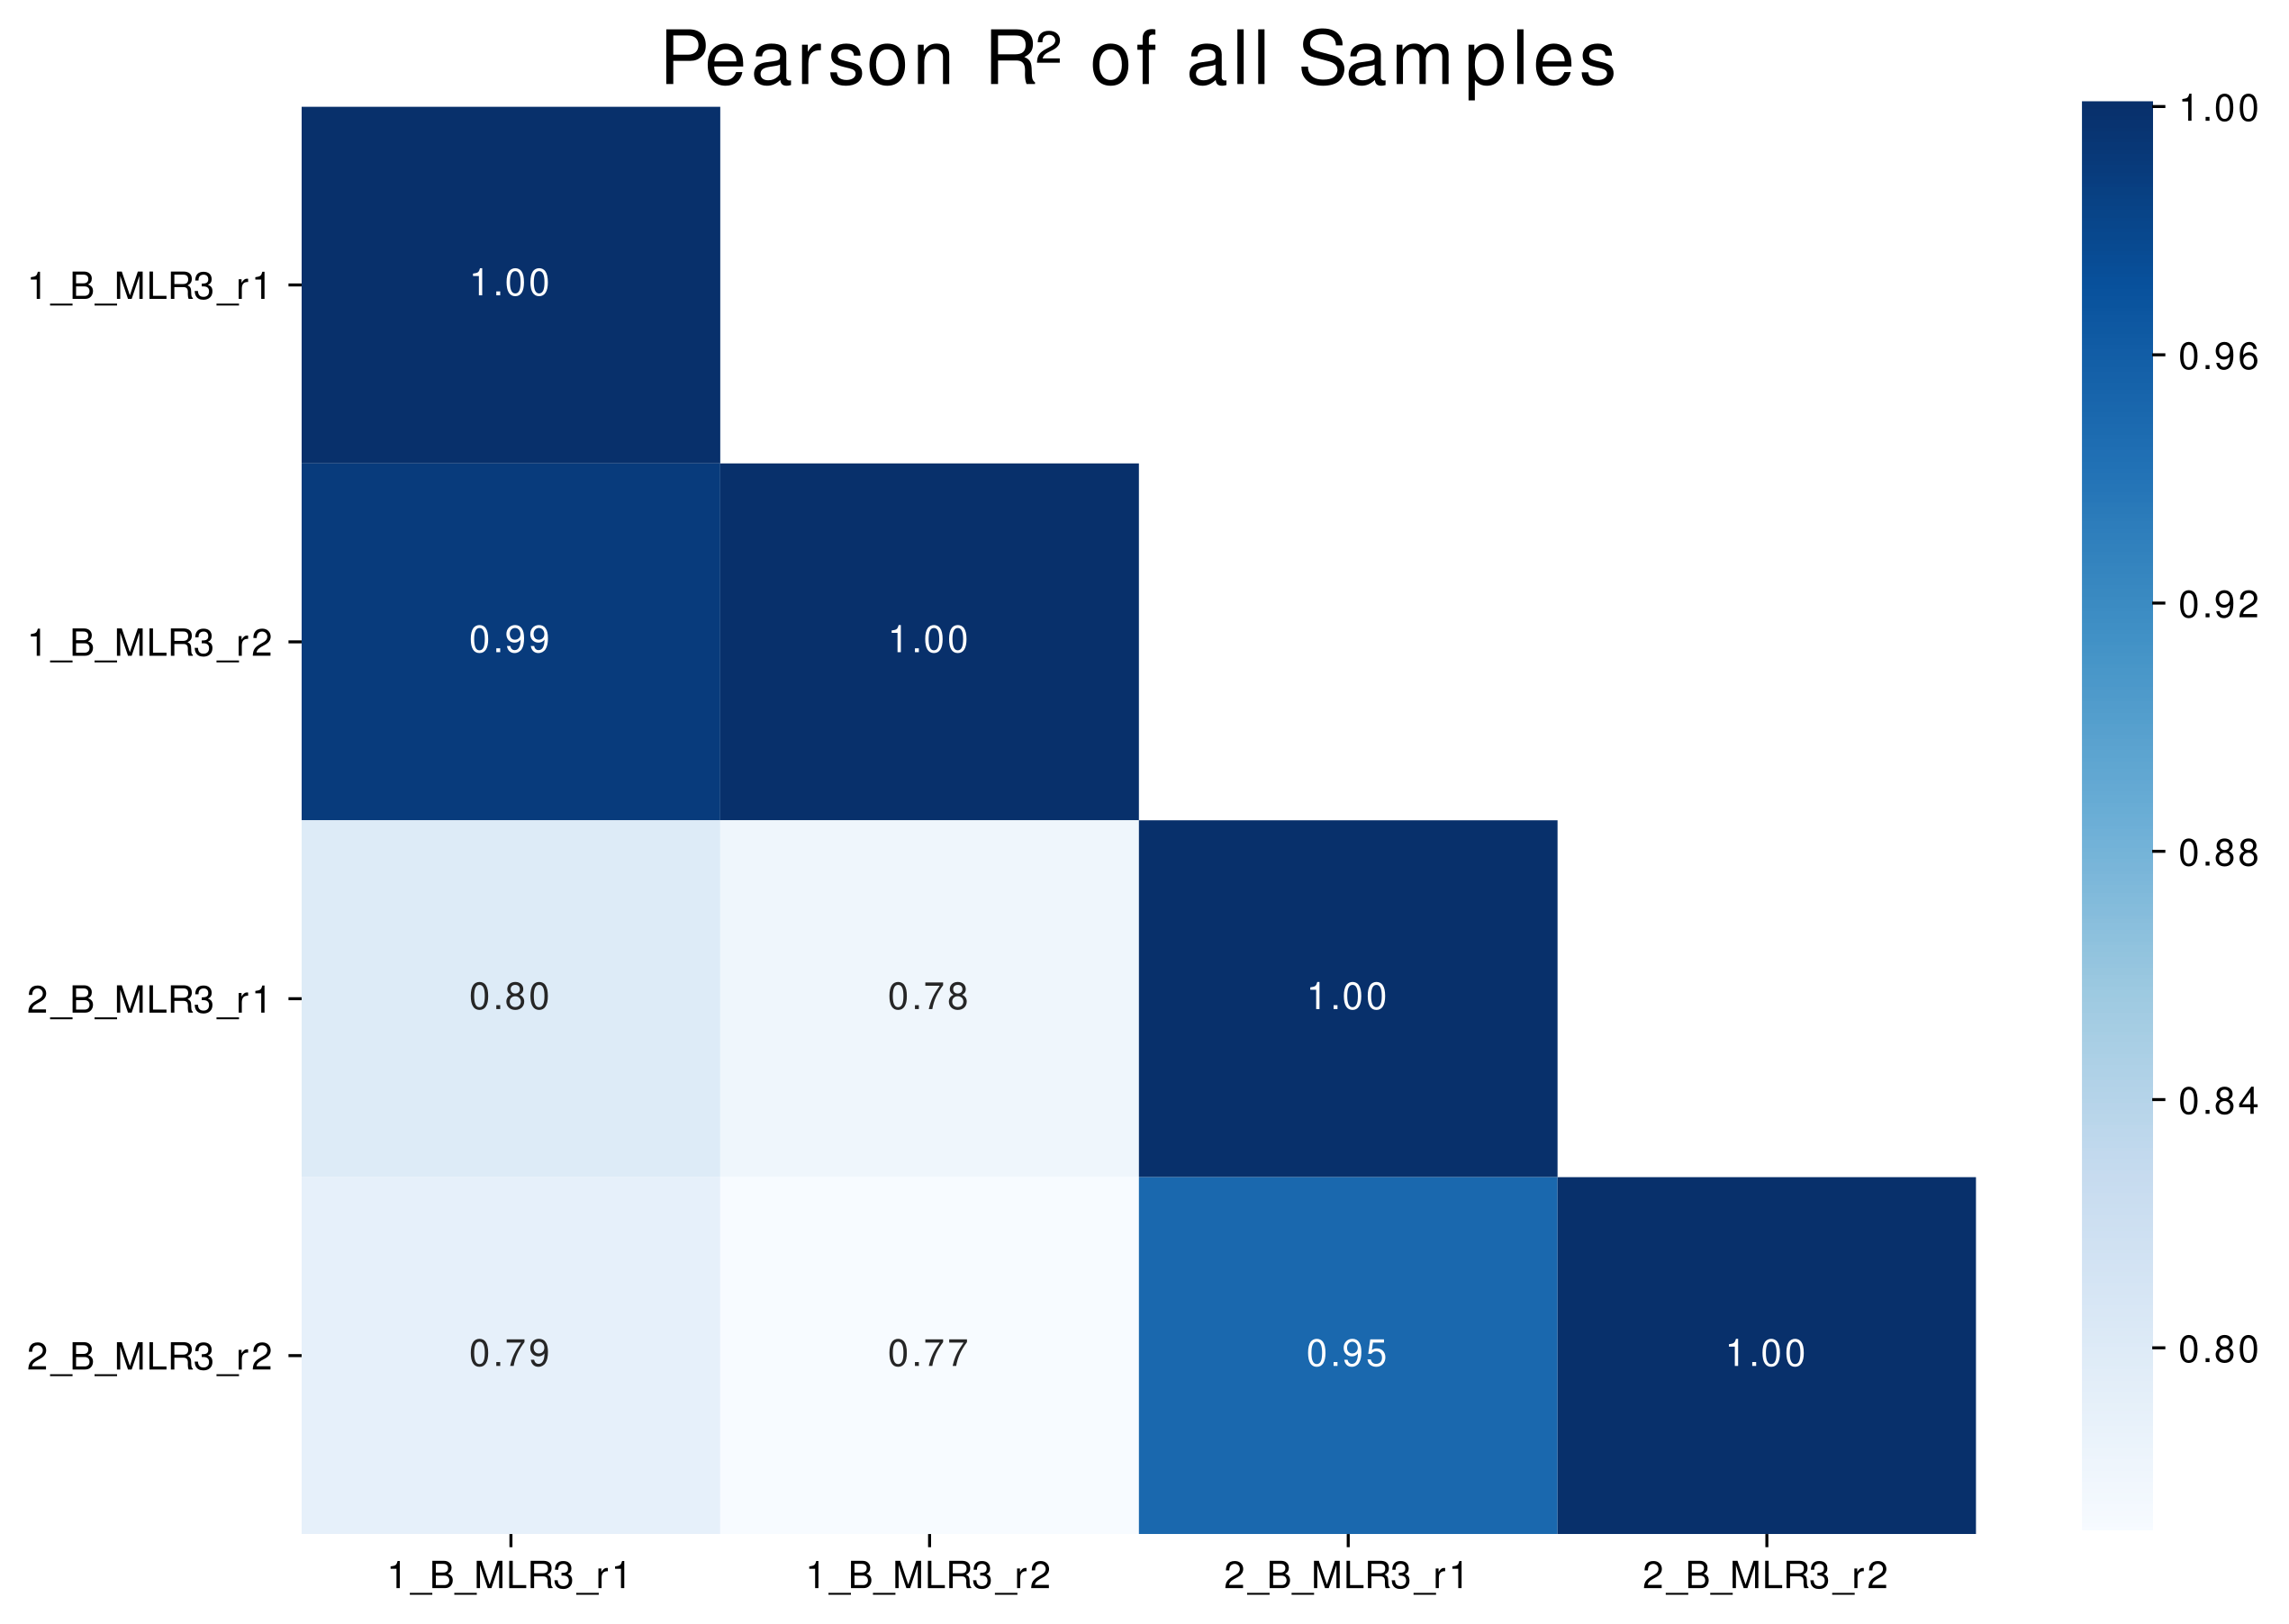
Figure 5B: Correlation map (Pearson R²) of |
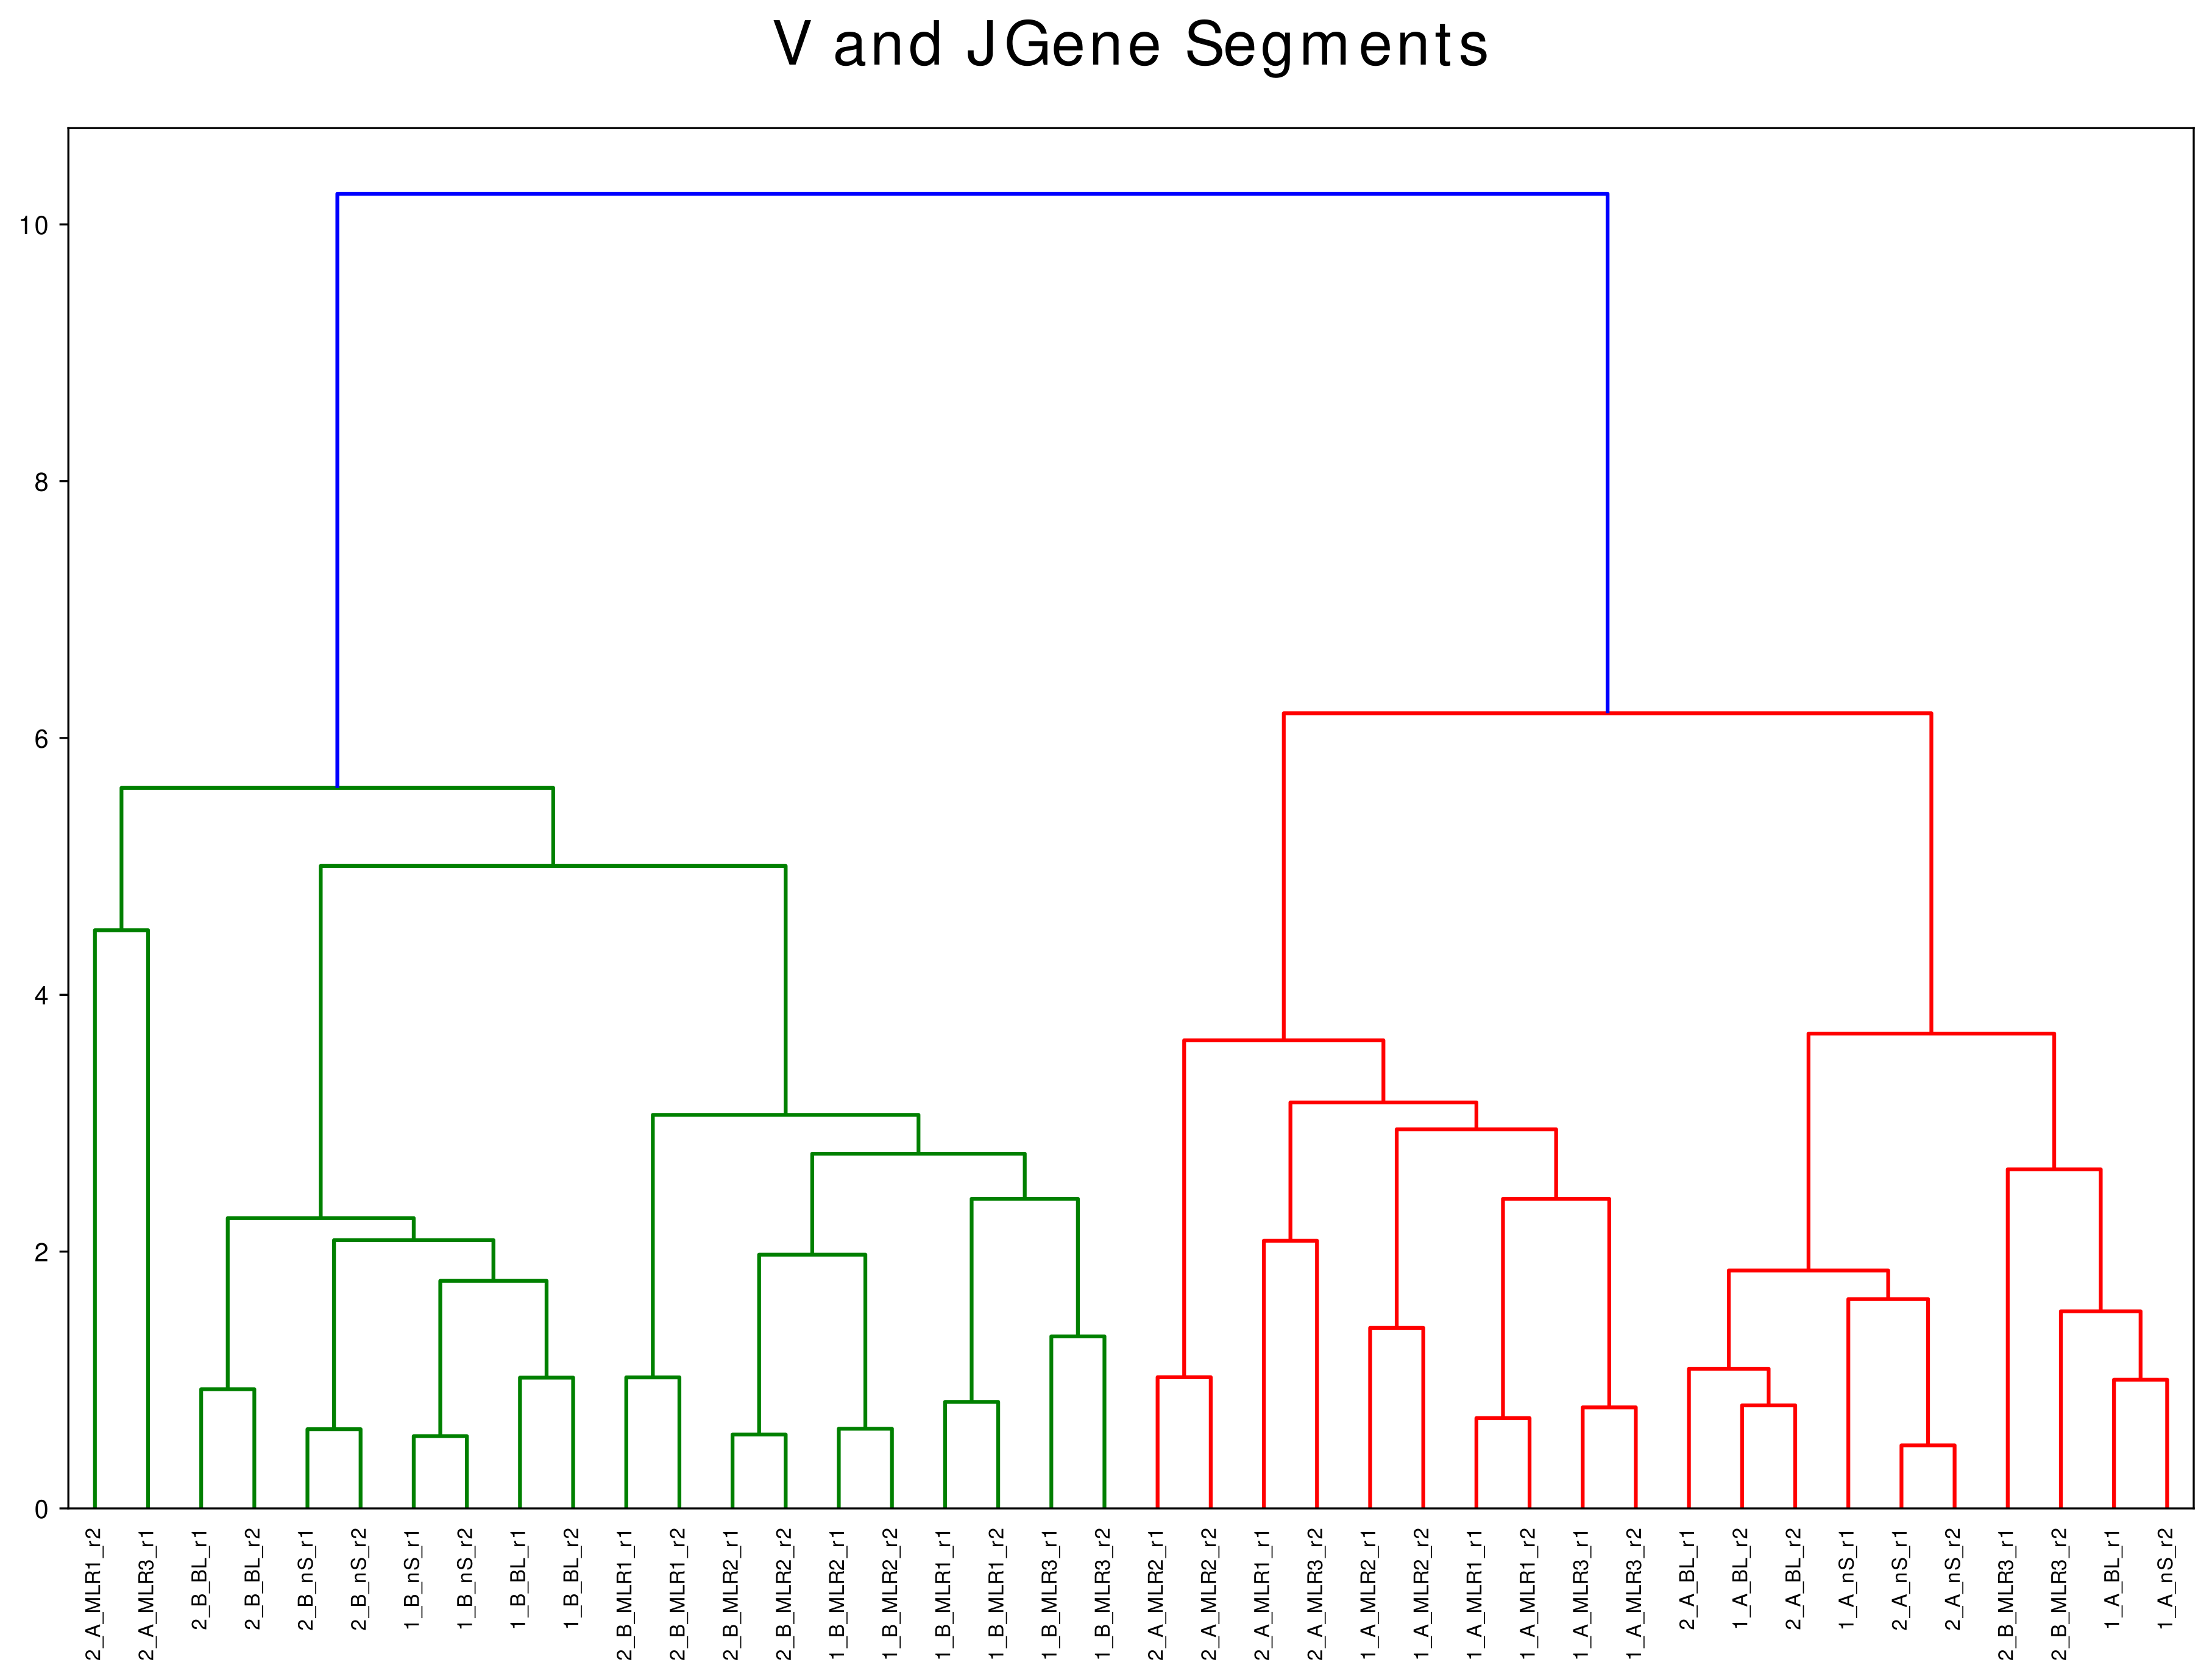
V(D)J Gene Segment Analysis
V and J gene segment pairing analysis allows first interpratations of the clonotype distribution and reveals information of potential overrepresented clonotypes.
The segment pairings are visualized using chord diagrams. The top 5 V and J gene segments, respectively, are labelled (Figure 6).
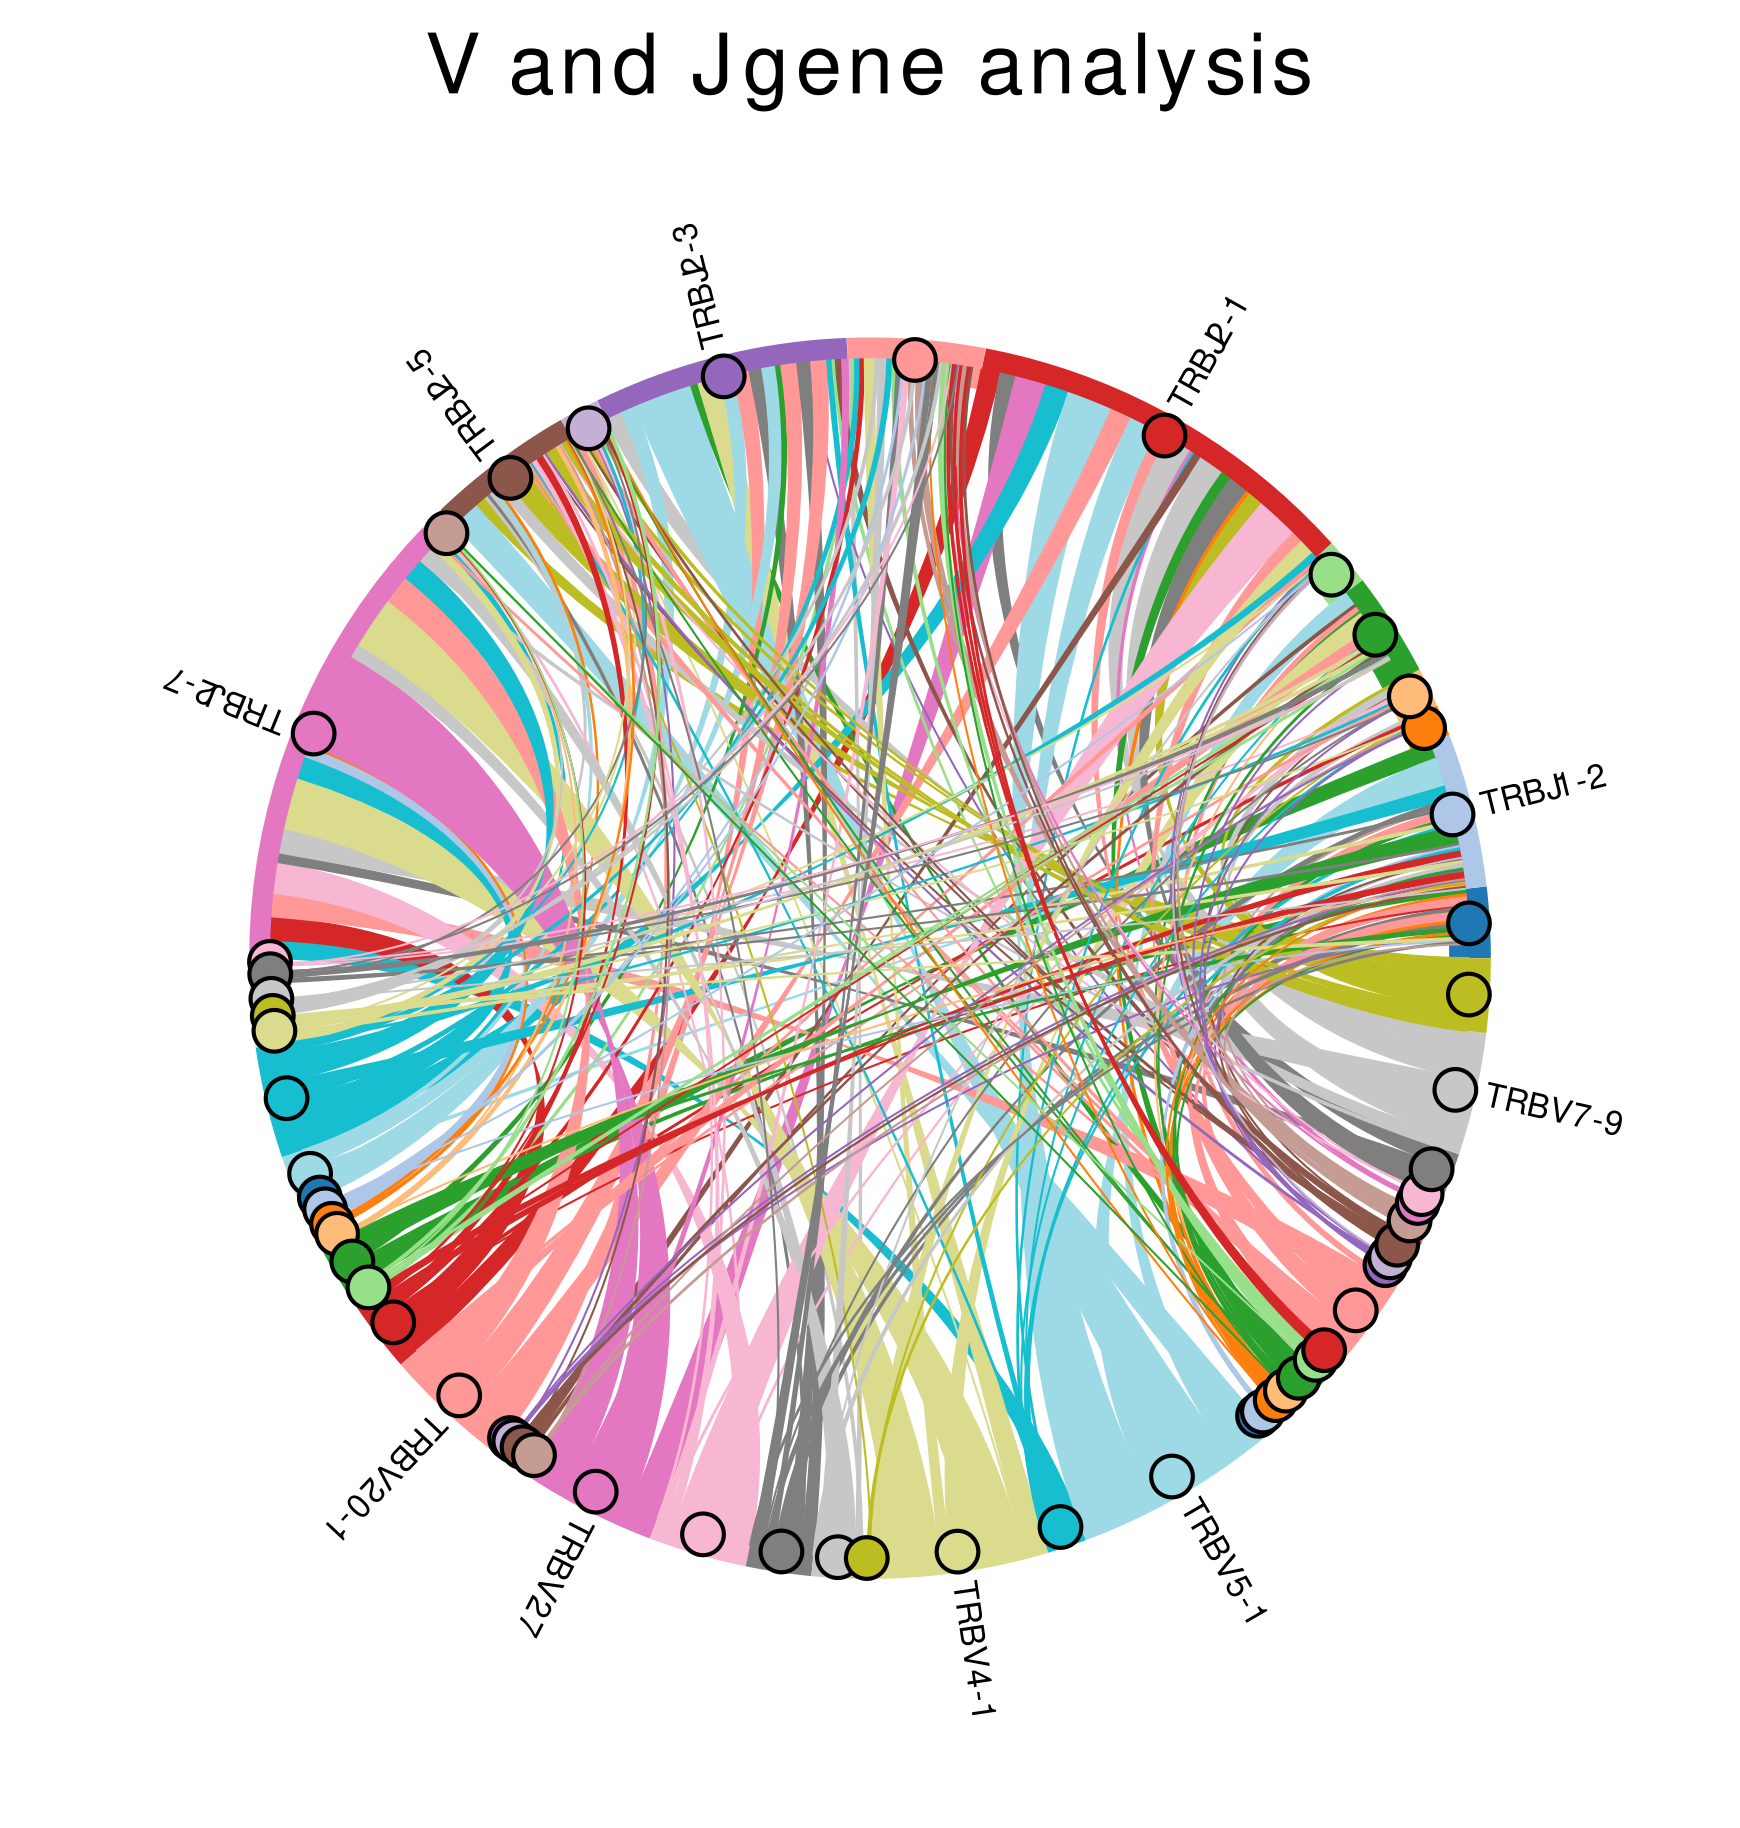
Figure 6: V and J gene segment pairing - the top 5 V and J gene segments are labelled