
Introduction
Spotty is a software tool that enables and simplifies the analysis of μpatterning data. Currently Spotty is capable of performing three different kinds of analysis, namely μPatterning analysis, intensity analysis, and FRAP analysis with various included additional analysis features, as described in the Features section.
Spotty is developed by researchers of the Bioinformatics Research Group at the University of Applied Sciences Upper Austria, Hagenberg Campus and by researchers of the Protein Interaction Lab at the University of Applied Sciences Upper Austria, Wels Campus within the research project μProt/DETECTOR, sponsored by the Basic Research Program of the University of Applied Sciences Upper Austria.
The μPatterning assay is a very sensitive method to detect protein-protein interactions in living cells ([I-III]). The basic principle can be explained as following: In order to identify and quantify interactions between a fluorophore-labelled protein (prey) and a membrane protein (bait) in vivo, a specific ligand to the exoplasmic domain of the bait is arranged in micropatterns on a glass surface. The intermediate gaps are passivated with BSA. When cells expressing the bait are plated on such surfaces, the bait follows the antibody patterns. To address bait-prey interactions, the lateral distribution of fluorescently tagged prey is analysed and compared with the antibody/BSA micropatterns. Interaction leads to pronounced co-patterning, whereas no interaction yields homogeneous prey-distribution.
<< BackDownload and Installation
Please download the latest stable version here (as .zip file) Spotty v. 1.3 and follow the subsequent instructions:- Right click on the downloaded *.zip file and select the menu item "Properties" in the context menu.
- If this property is visible, click "Unblock" and "OK" to close the "Properties" window.
- Extract the content of the downloaded .zip file in a separate folder.
- Navigate to the extracted folder and double-click on Spotty.bat.
<< Back
Features
Currently the following analyses are implemented in Spotty:μPatterning Analysis
By clicking on the menu items Analysis -> μPatterning -> μPatterning Analysis a new analysis for μPatterning data can be started. In the beginning the needed image files have to be imported using the image importer. The following files are required for a standard μPatterning analysis:
- a grid picture, showing an image of the used micropatterns on glass surface, and
- one or more pattern images, showing the to be analysed cells.
Import Images
Using the image importer options it is possible to change the maximum intensity value, used afterwards as a scaling factor for all visualizations, to change the group count (the number of images that represent an analysis group), and to adjust or assign the rule of each image (grid or pattern/additional view).
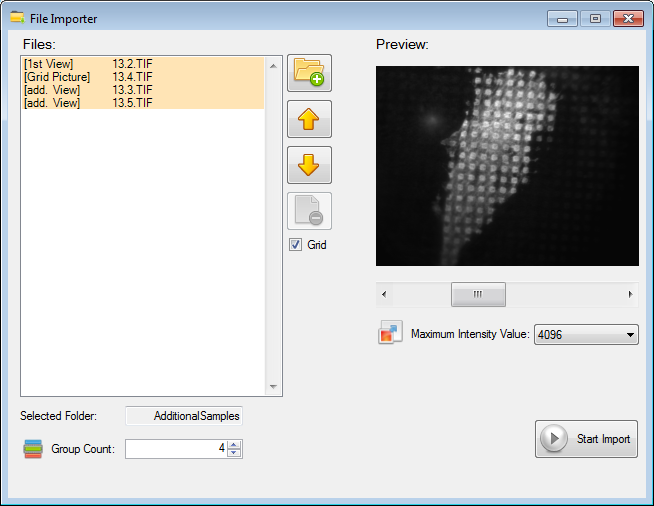
Figure 1: μPatterning file importer.
After the import process has been finished, the μPatterning analysis window is shown. By clicking on the tabpage Parameters all used analysis parameters are shown and can be adjusted independently.
Each analysis can be performed either manually (by clicking on the analysis tabpage) or automatically (by clicking on a group node and on the start button). An automatic analysis performs all analysis steps (gridding, cell detection, background correction, result calculation, and visualization) consecutive and automatically without any user interaction needed. Afterwards, all calculated results, regardless which kind of analysis was performed (manual or automatic), can be found by clicking on the individual image sets -> Analysis -> Evaluation Results.
Gridding & Grid Refinement
In order to be able to separate each single signal on the pattern images, it is necessary to identify and define grid structures in between the given grid image. This gridding process is also performed automatically, but can be refined and adjusted by using the grid refinement feature. Using this additional feature it is possible to adjust the position of the grid in-between the image, to adjust the gridwidth, and to change the deflection of the given grid. Furthermore, it is even possible to manually define a grid without performing any automatic gridding procedure, which can be useful if no fitting grid image exists. At the moment, Spotty supports two different types of grid structures, namely line and hexagonal structures.
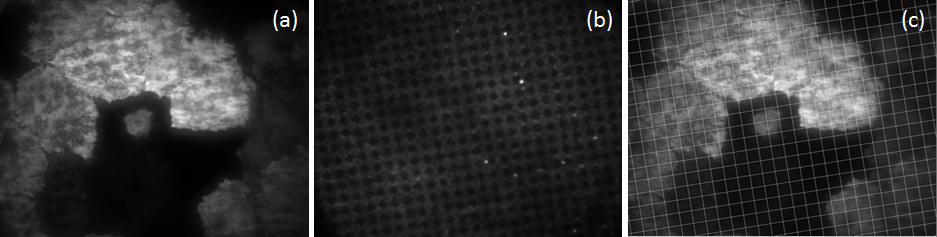
Figure 2: Exemplary imported pattern image (a), line grid image (b), and corresponding extracted line grid drawn on pattern image (c).
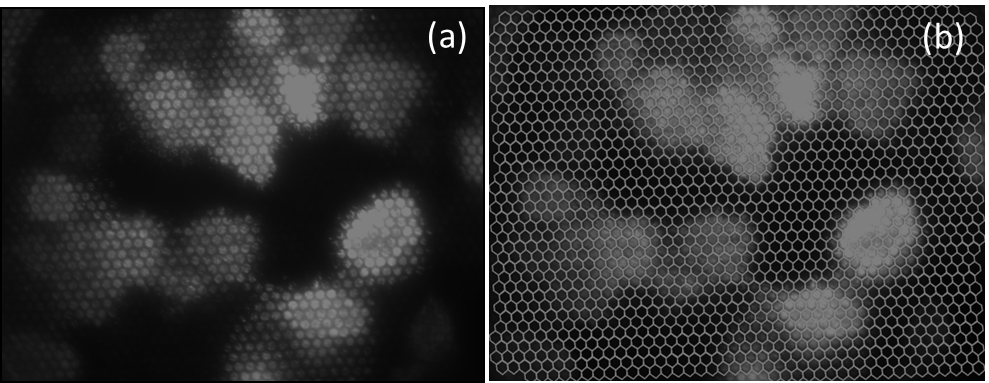
Figure 3: Exemplary imported pattern image (a) and corresponding extracted hexagonal grid drawn on pattern image (b).
Pattern Selection & Adjustment
After the gridding process is finished, all cells on the given pattern images have to be selected. This process can also be performed either manually by clicking on the image (single click sets boundary point, double click closes drawn polygon) or automatically by clicking on Detect Cells. Each cell can be further adjusted using the Position Adjustment functionality. This functionality is designed and implemented in order to overcome the obstacle of moved areas over time.
Spot Radius & Global Background
In order to conclude the analysis two further parameters have to be set: A spot radius that illustrates the size of the detected signal in comparison to the background and the global background value to correct the contrast calculation have to be defined.
Evaluation Results
As evaluation results multiple statistical features are calculated per pattern and per view (image). Namely the following features are calculated:
Per view:- number of evaluated patterns,
- average spot intensity (F+),
- average background intensity (F-),
- average contrast value (calculated as (F+ - F-)/ (F+ - GlobalBackground)).
- average spot intensity (F+),
- average background intensity (F-),
- average contrast value (calculated as (F+ - F-)/ (F+ - GlobalBackground)),
- delta value (F+ - F-).
Furthermore, all results are visualized as bubble charts and heatmaps. A screenshot of an exemplary μPatterning result can be seen in Figure 4.
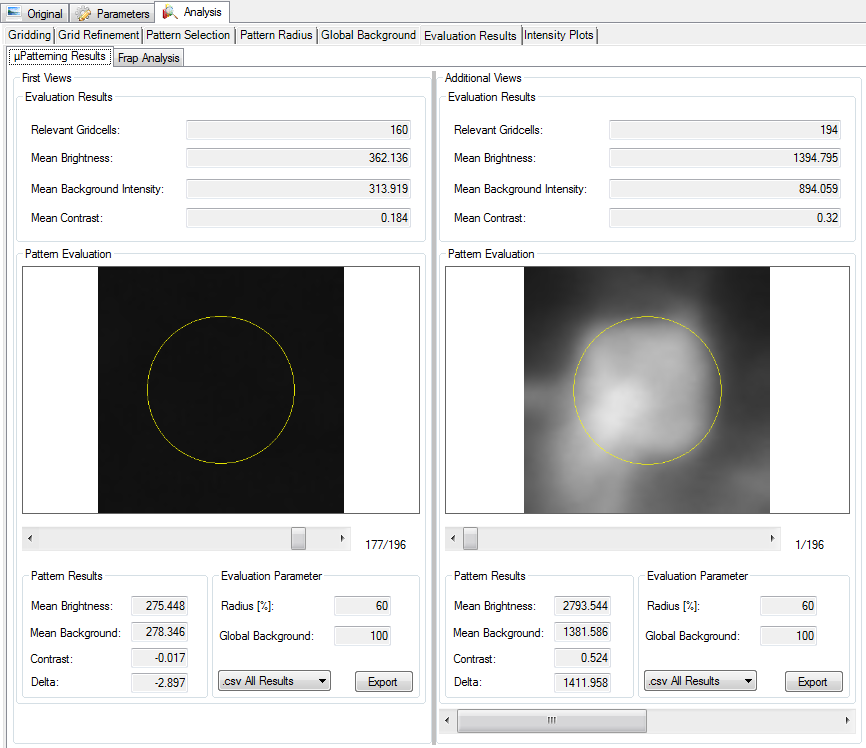
Figure 4: Exemplary generated μPatterning result showing all calculated feature values per pattern and per view.
Contact
The research project μProt/DETECTOR was sponsored by the Basic Research Program of the University of Applied Sciences Upper Austria and was a collaboration of the Protein Interaction Lab at the University of Applied Sciences Upper Austria, Wels Campus and the Bioinformatics Research Group at the University of Applied Sciences Upper Austria, Hagenberg Campus.
If there are any questions, problems, ideas please do not hesitate to contact Daniela Borgmann, Peter Lanzerstorfer,
Verena Stadlbauer,
Julian Weghuber, or Stephan Winkler.
Publications
-
V. Stadlbauer, R. Haselgrübler, P. Lanzerstorfer, B. Plochberger, D. M. Borgmann, J. Jacak, S. M. Winkler,
K. Schröder, O. Höglinger, J. Weghuber - Biomolecular Characterization of Putative Antidiabetic Herbal Extracts - PLoS One, Vol. 28, No. 11, 2016 [online] -
D. M. Borgmann, P. Lanzerstorfer, V. Stadlbauer, U. Müller, S. M. Winkler, J. Weghuber - Bioinformatic analysis of total internal reflection fluorescence microscopy (TIRFM) data in the context of type 2 diabetes and cancer signaling - Proceedings of the 23rd Annual International Conference on Intelligent Systems for Molecular Biology (ISMB), Dublin, Irland, 2015 [online]
-
P. Lanzerstorfer, V. Stadlbauer, L. Chtcheglova, R. Haselgrübler, D. M. Borgmann, J. Wruss, P. Hinterdorfer,
K. Schröder, S. M. Winkler, O. Höglinger, J. Weghuber - Identification of novel insulin mimetic drugs by quantitative total internal reflection fluorescence (TIRF) microscopy - British Journal of Pharmacology, Vol. 171, No. 23, 2014, pp. 5237-5251 [online] -
P. Lanzerstorfer, V. Stadlbauer, D. M. Borgmann, J. Wruss, K. Schröder, S. M. Winkler, O. Höglinger, J. Weghuber - Identification of Novel Insulin Mimetic Drugs by Quantitative TIRF Microscopy - Biophysical Society Meeting 2014, San Francisco, USA, 2014 [online]
-
V. Stadlbauer, P. Lanzerstorfer, D. M. Borgmann, J. Wruss, K. Schröder, S. M. Winkler, O. Höglinger, J. Weghuber - Total Internal Reflection Fluorescence (TIRF) Microscopy Guided Quantification of GLUT4 Translocation for the Identification of Insulin Mimetic Drugs - Biophysical Journal, Vol. 106, No. 2, 2014 [online]
-
P. Lanzerstorfer, D. M. Borgmann, A. Steininger, S. Schaller, M. Brameshuber, S. Sunzenauer, O. Höglinger,
J. Weghuber - Analysis of Protein-Protein Interactions in Live Cells - The Micropatterning Approach in Basic Methods in Protein Purification and Analysis, 2012 [online] -
S. Schaller, J. Jacak, D. M. Borgmann, J. Weghuber, S. M. Winkler - An Image Analysis Suite for Automated Spot Detection in Cellular and Nano Structures of Microscopy Images - Proceedings of the 20th Annual International Conference on Intelligent Systems for Molecular Biology (ISMB), Long Beach, CA, USA, 2012 [online]
-
D. Borgmann, J. Weghuber, S. Schaller, J. Jacak, S. M. Winkler - Identification of Patterns in Microscopy Images of Biological Samples using Evolution Strategies - Proceedings of the 24th European Modeling and Simulation Symposium EMSS 2012, Vienna, Austria, 2012, pp. 271-276 [online]
-
S. Schaller, S. M. Winkler, J. Weghuber, M. Sams, J. Jacak - μDetect: Design of a Framework for Optimized Structure Analysis in Fluorescence Microscopy Images - Proceedings of 6th FFH 2012, Graz, Austria, 2012, pp. 125-129 [online]
2016
2015
2014
2012
Old Releases
-
Spotty v. 1.2 02.2016
- Spotty v. 1.1 09.2015
References
-
Schwarzenbacher, M., Kaltenbrunner, M., Brameshuber, M., Hesch, C., Paster, W., Weghuber, J., Heise, B., Sonnleitner, A., Stockinger, H., Schütz, G. J., 2008. Micropatterning for quantitative analyses of protein-protein interactions in living cells. Nature methods 5:1053-1060.
-
Weghuber, J., Sunzenauer, S., Plochberger, B., Brameshuber, M., Haselgrübler, T., Schütz, F. J., 2010. Temporal resolution of protein-protein interactions in the live-cell plasma membrane. Analytical and Bioanalytical Electrochemistry 397:3339-3347.
-
Weghuber, J., Brameshuber, M., Sunzenauer, S., Lehner, M., Paar, C., Haselgrübler, T., Schwarzenbacher, M., Kaltenbrunner, M., Hesch, C., Paster, W., Heise, B., Sonnleitner, A., Stockinger, H., Schütz, G.J., 2010. Detection of protein-protein interactions in the live cell plasma membrane by quantifying prey redistribution upon bait micro patterning. Methods in Enzymology, 472:133-151.