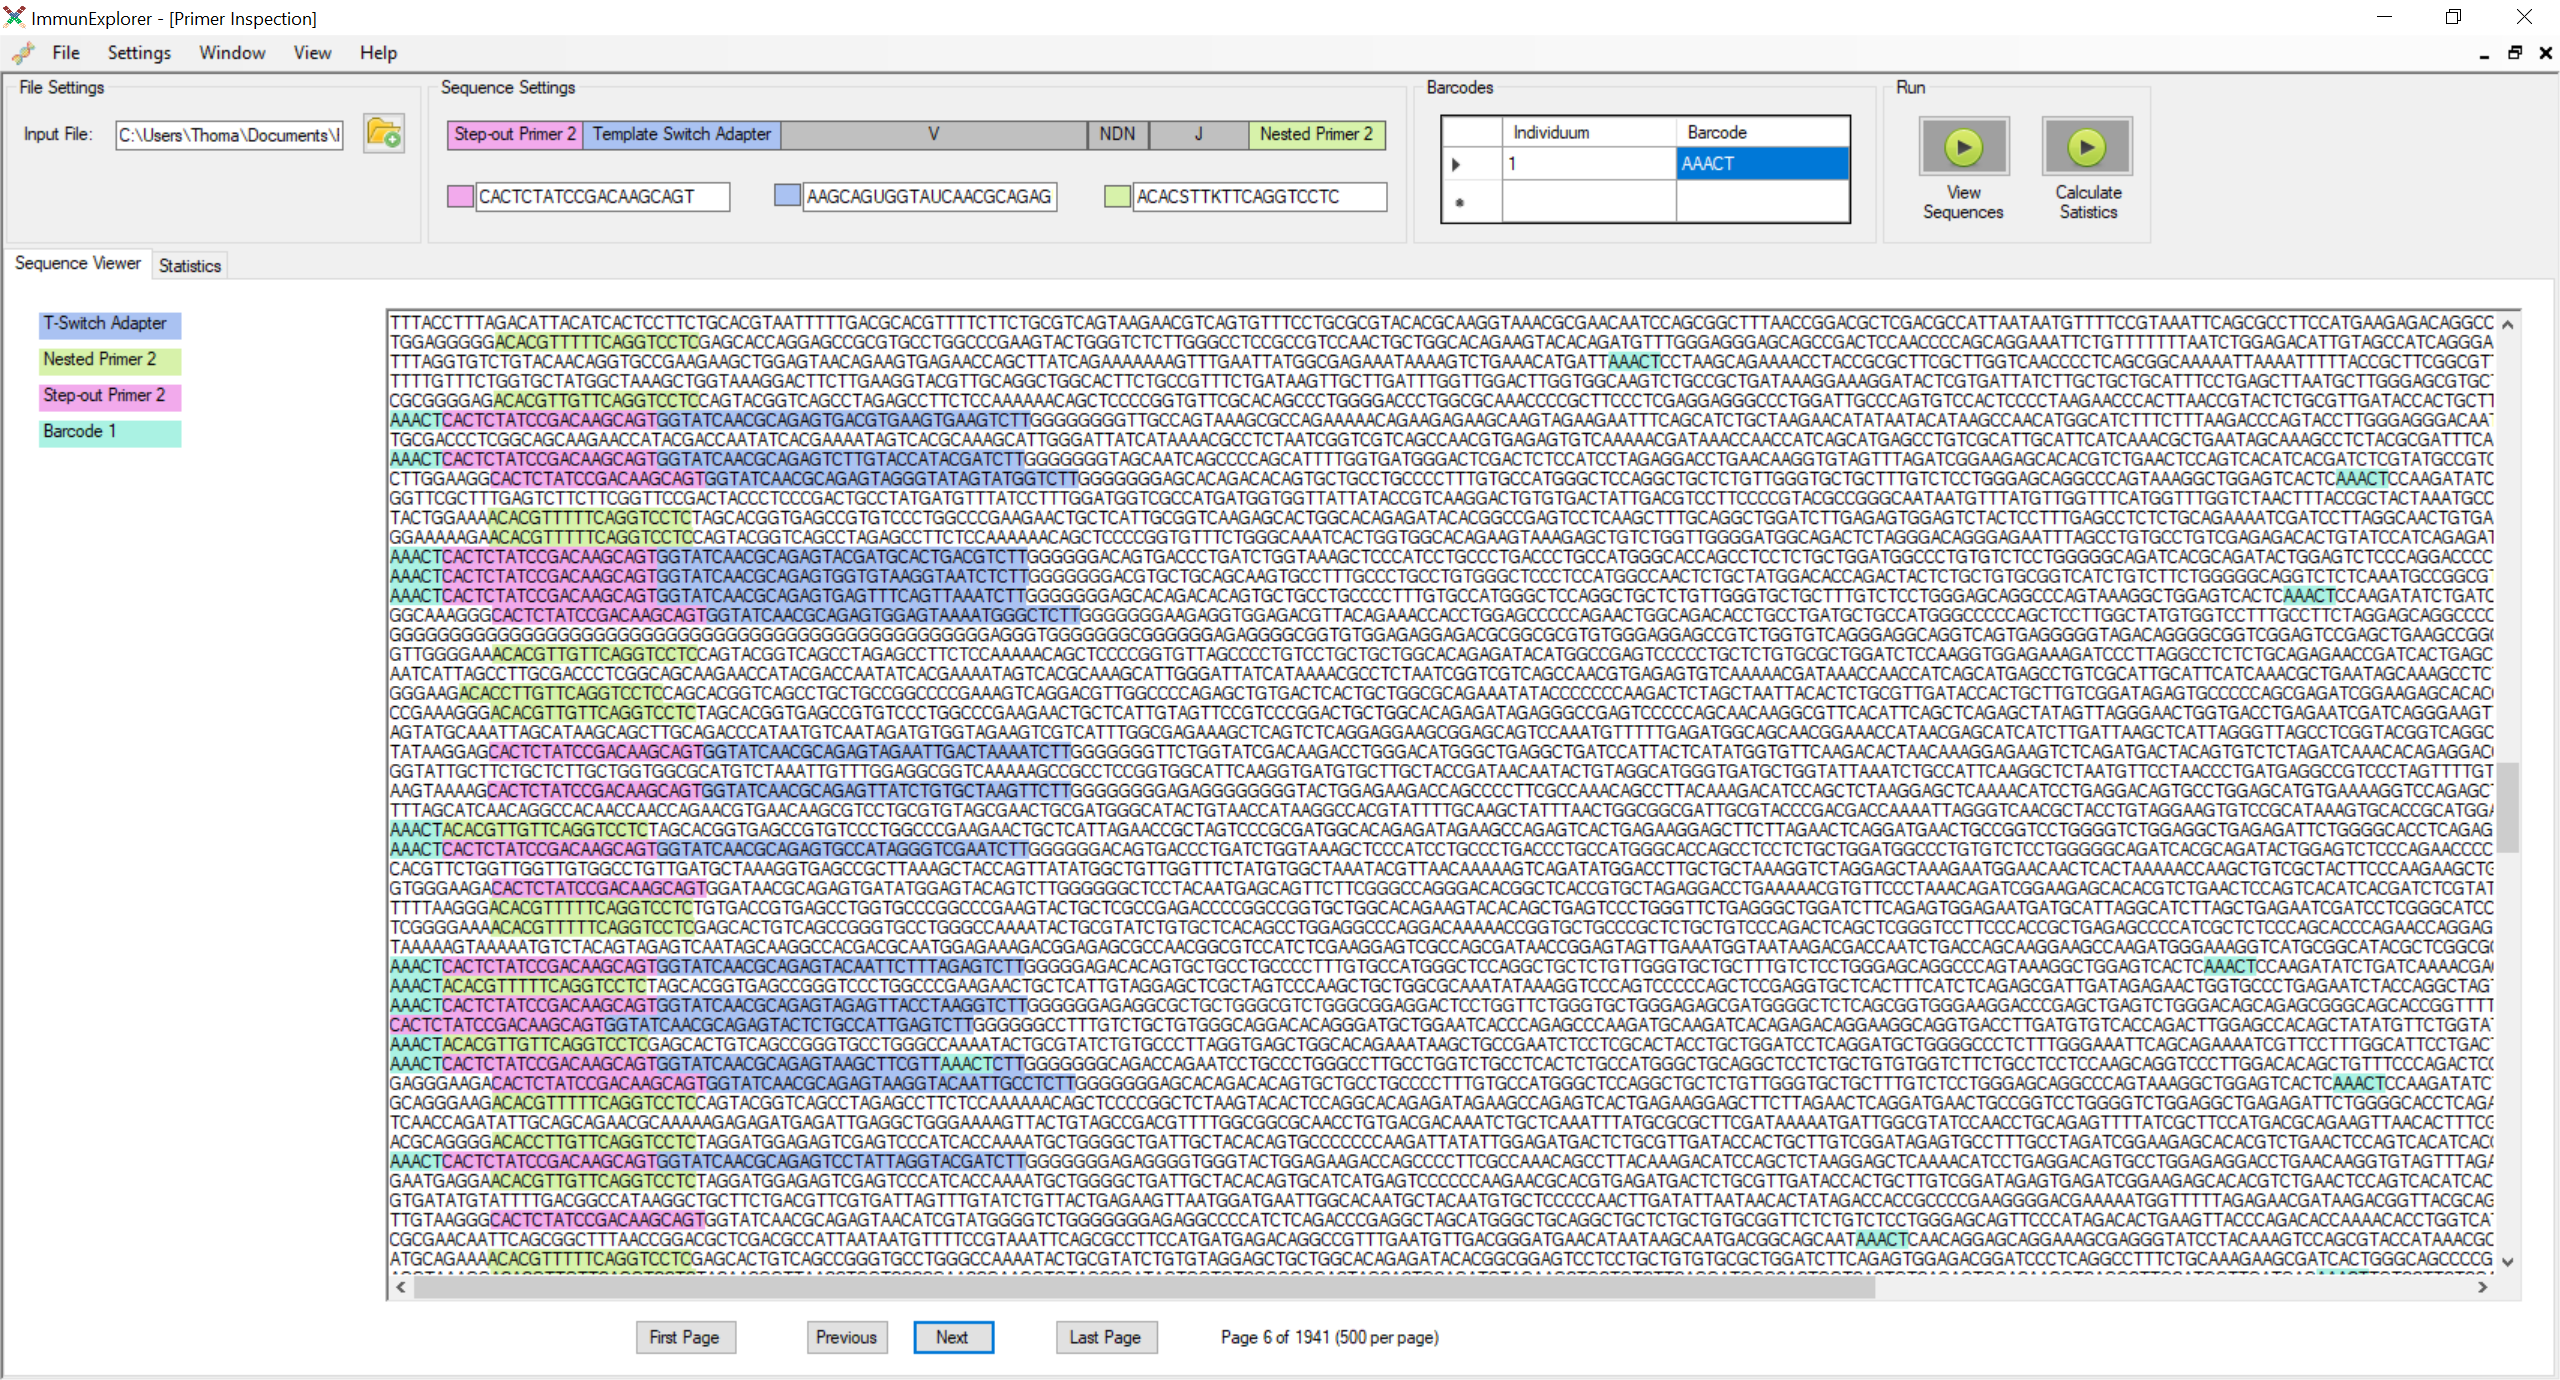
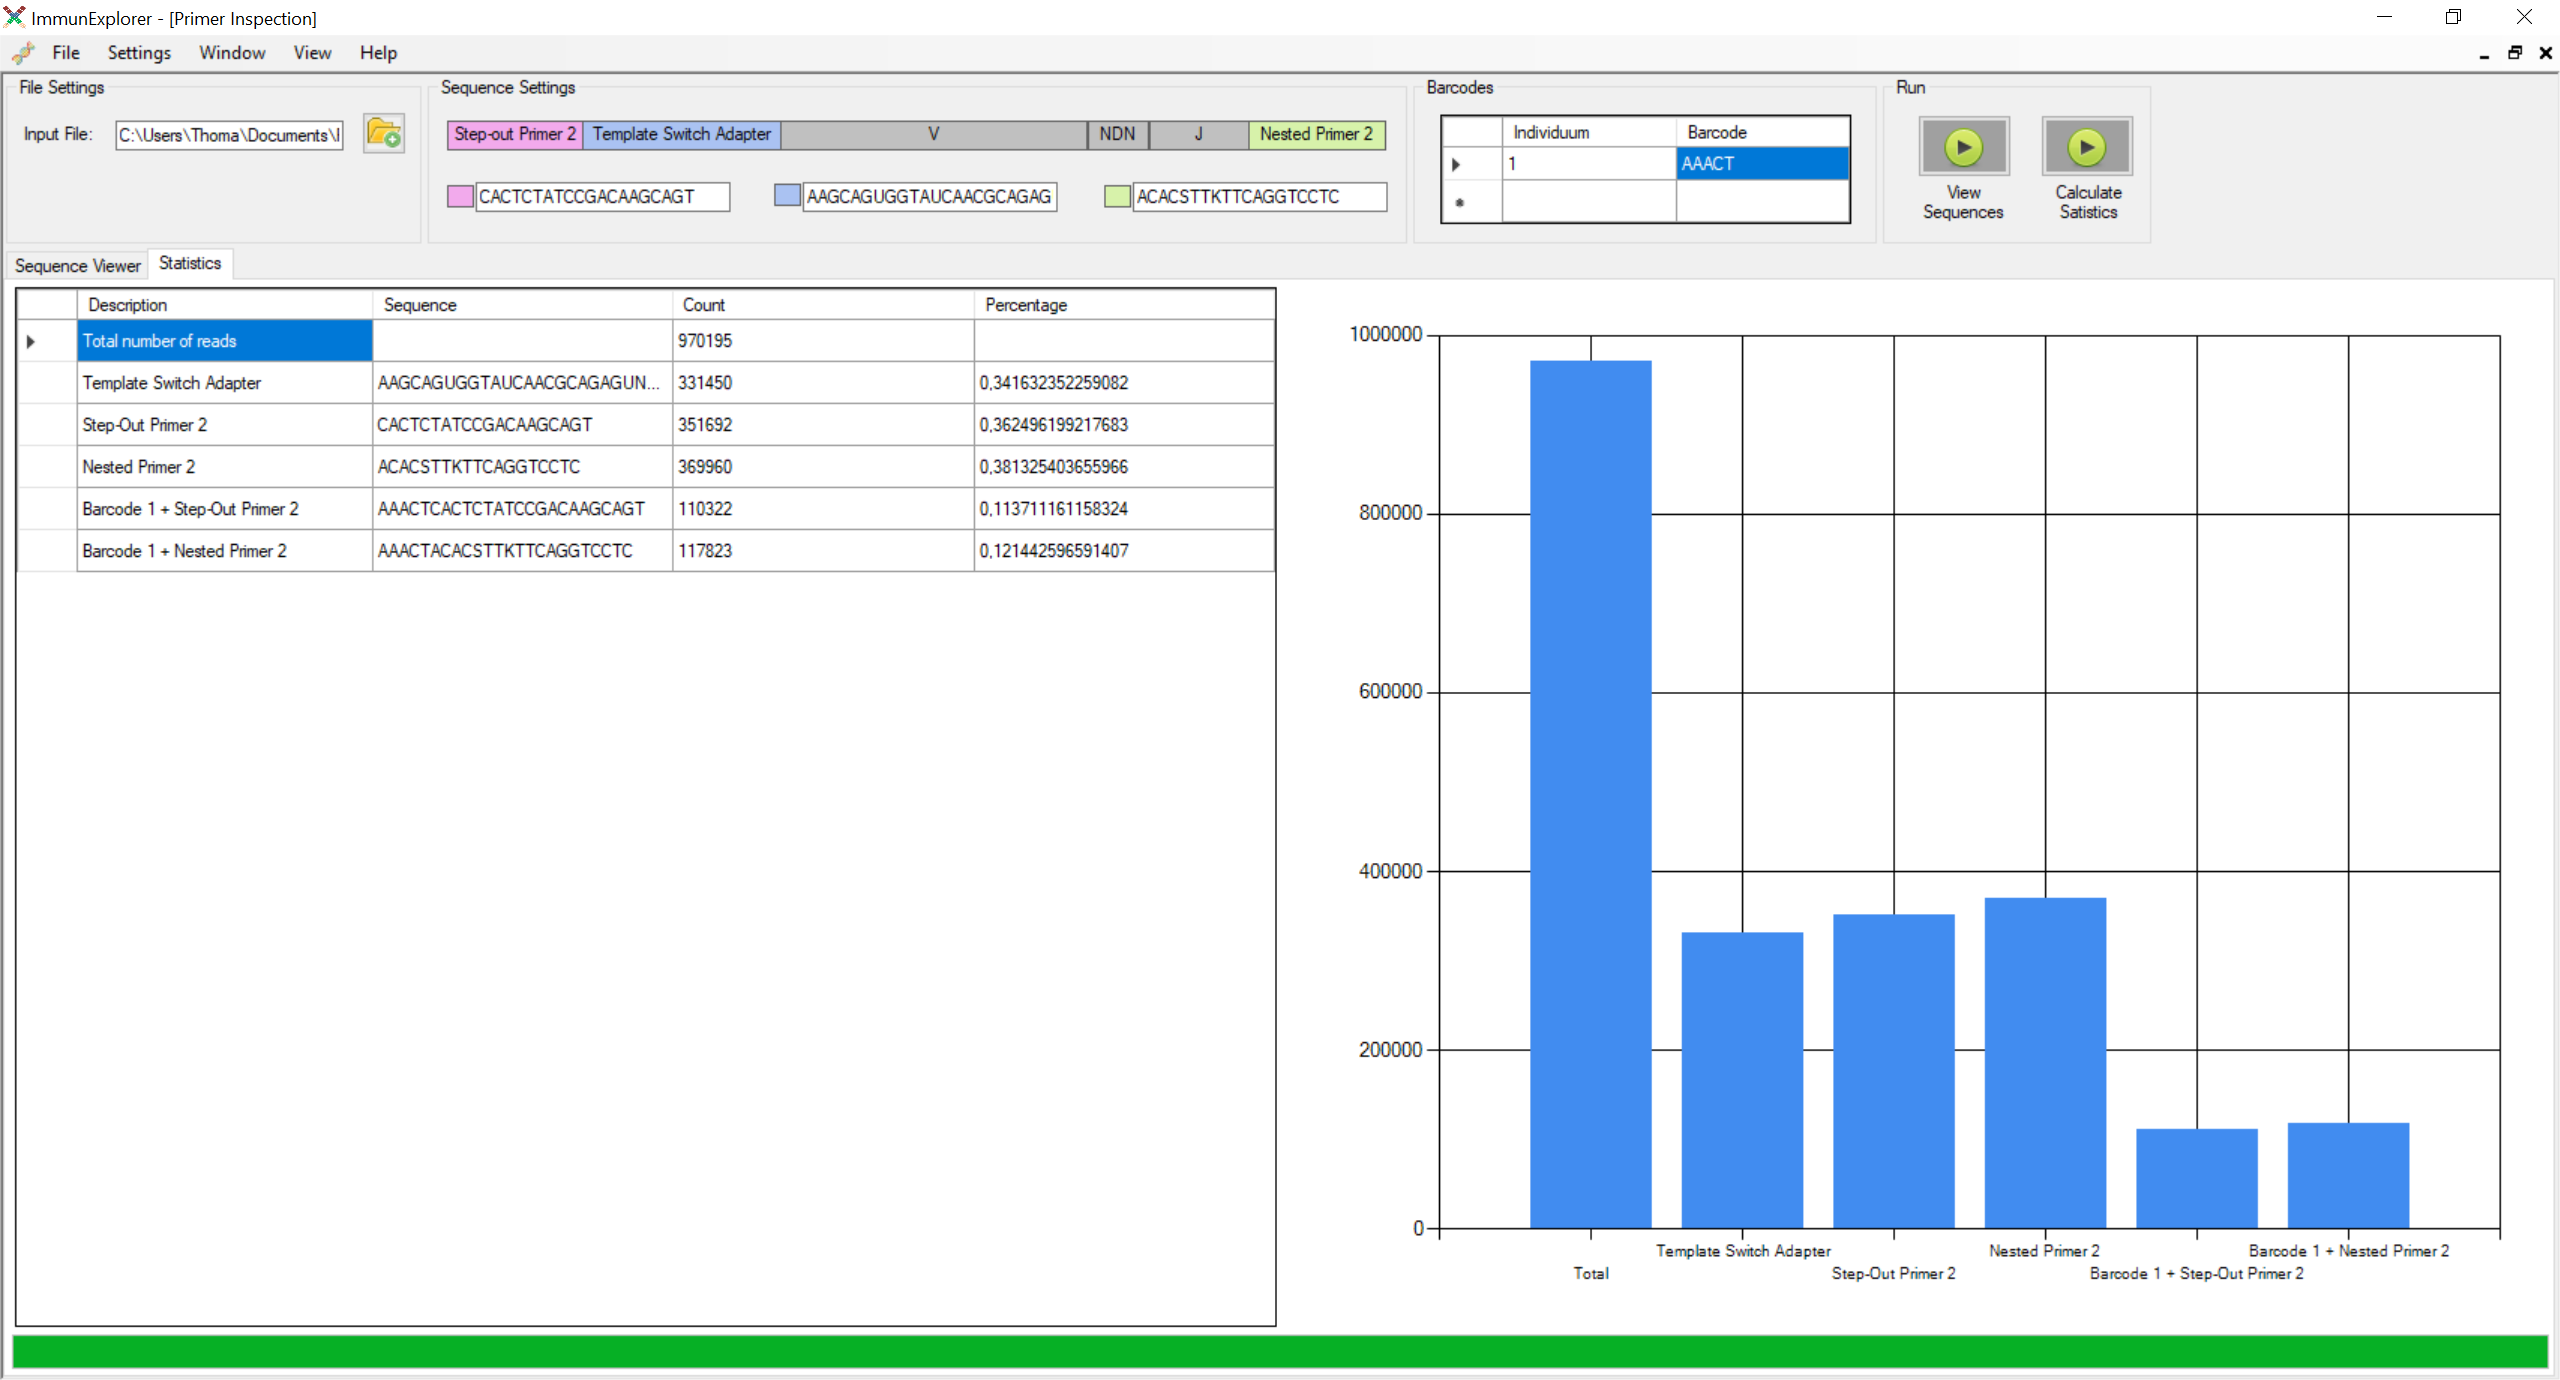
Primer analysis

The primer analysis tool allows for easy visual and statistical analysis of primer sequences in T-cell receptor repertoire NGS data (*.fastq and *.fastq.gz). Primer and adapter sequences can be changed to match the sequences used in library preparation. Multiple barcode sequences representing individuals can be added for observation.

_images/primerAnalysisInputs.png

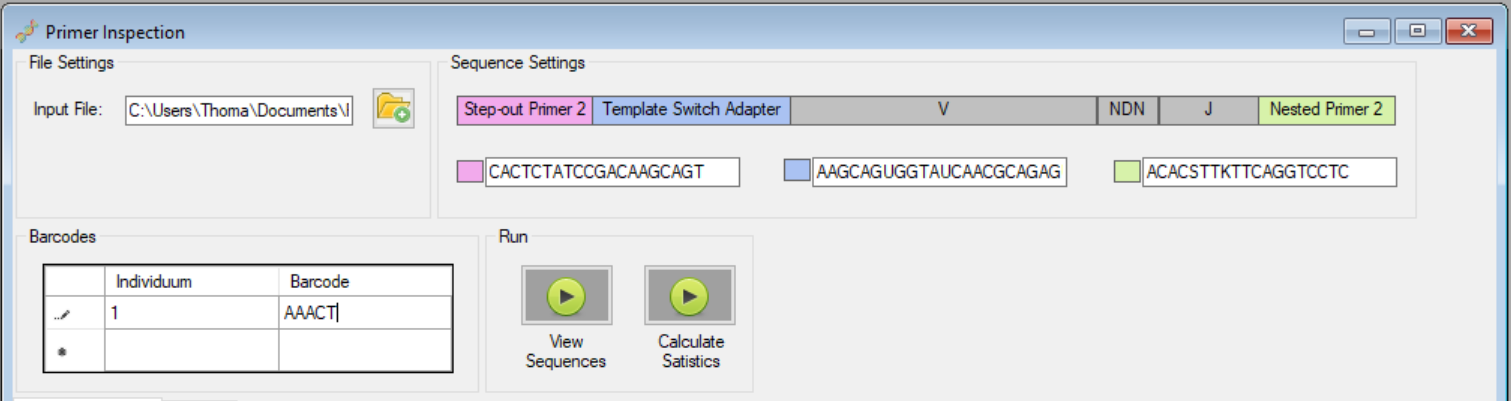
Figure 5: Primer analysis inputs

Sequence viewer

The sequence viewer tab highlights primer, adapter, and barcode sequences in reads for easy analysis. The whole input file can be browsed in pages of 500 reads (one read per line).

_images/primerAnalysis.png

Figure 6: Primer analysis sequence viewer

Statistics

The statistics tab calculates frequencies of sequences and relevant sequence combinations. The results are displayed in a table aswell as a bar chart.

_images/primerAnalysisStatistics.png

Figure 7: Primer analysis statistics